Comparison of the Course of the 5/20 Growth Indicator and the Confirmed Number of Coronavirus Infections for nine European Countries
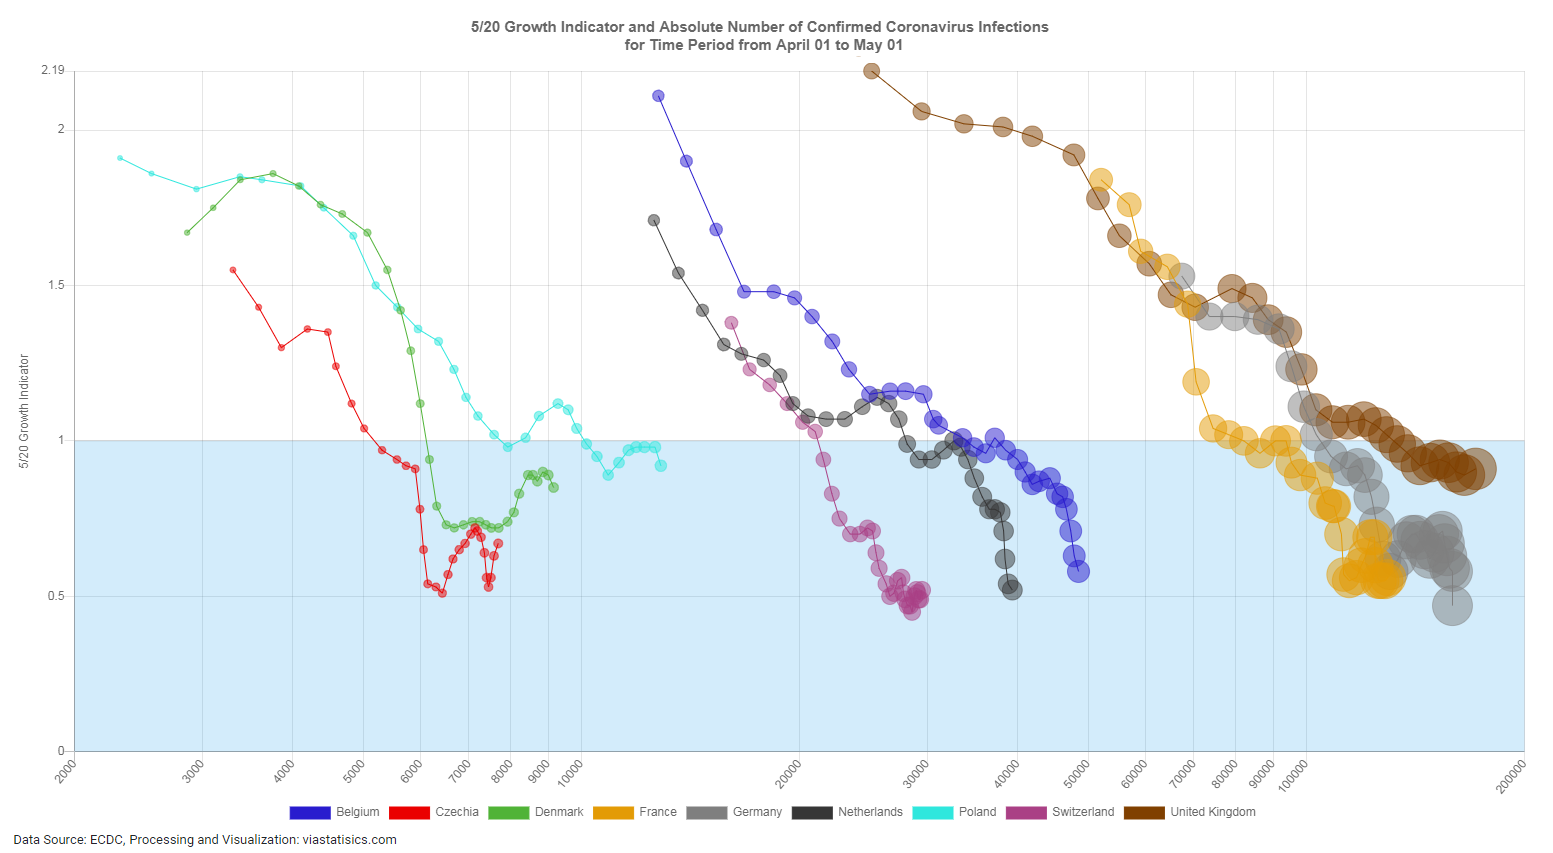
This diagram is based on data of the European Center for Desease Prevention and Control of April 1st until May 1st.
The 5/20 Growth Indicator tells us, how the absolute number of daily new infections has developed over the last 20 days. It is defined as the average number of daily new infections of the last 5 days divided by the average number of daily new infections of the last 20 days. Therefore a value around 1 indicates that nothing much has changed during the last 20 days concerning the average of the daily number of new coronavirus infections. A value greater than 1 tells us that the daily number of new infections tends to increase and a value smaller than 1 indicates that the number of new infections tends to decrease.
We desire to have a value signifcantly lower than 1. It is encouraging that the 5/20 Indicator is smaller than 1 in all nine European countries considered and in several cases significantly smaller than 1.